On this page
Get involved
Help us develop the Housing Toolkit by sharing your feedback on what tools and housing designs are the best fit for your community!
About this project
On the Blue Hill Peninsula, unaffordability, high demand, and construction challenges have contributed to a housing market that is not financially accessible for most households. Housing Opportunities on the Peninsula (HOOP) is a 10-town collaboration to increase and diversify local housing supply to meet community needs, including homes for seniors, families, and the workforce.
This project will assess the Peninsula's housing needs and goals (including the impact of seasonal housing and short-term rentals), identify the most suitable locations for new housing, and recommend innovative housing solutions. Then, the team will build a Housing Development Toolkit that brings together context-specific case studies for missing middle housing with construction, infrastructure, financing, and regulatory strategies. Work spans from March to December 2026.
Residents of these 10 communities are also planning to start a new nonprofit to advocate for, and build, more housing on the Blue Hill Peninsula. Enter your email address if you are interested in learning more!
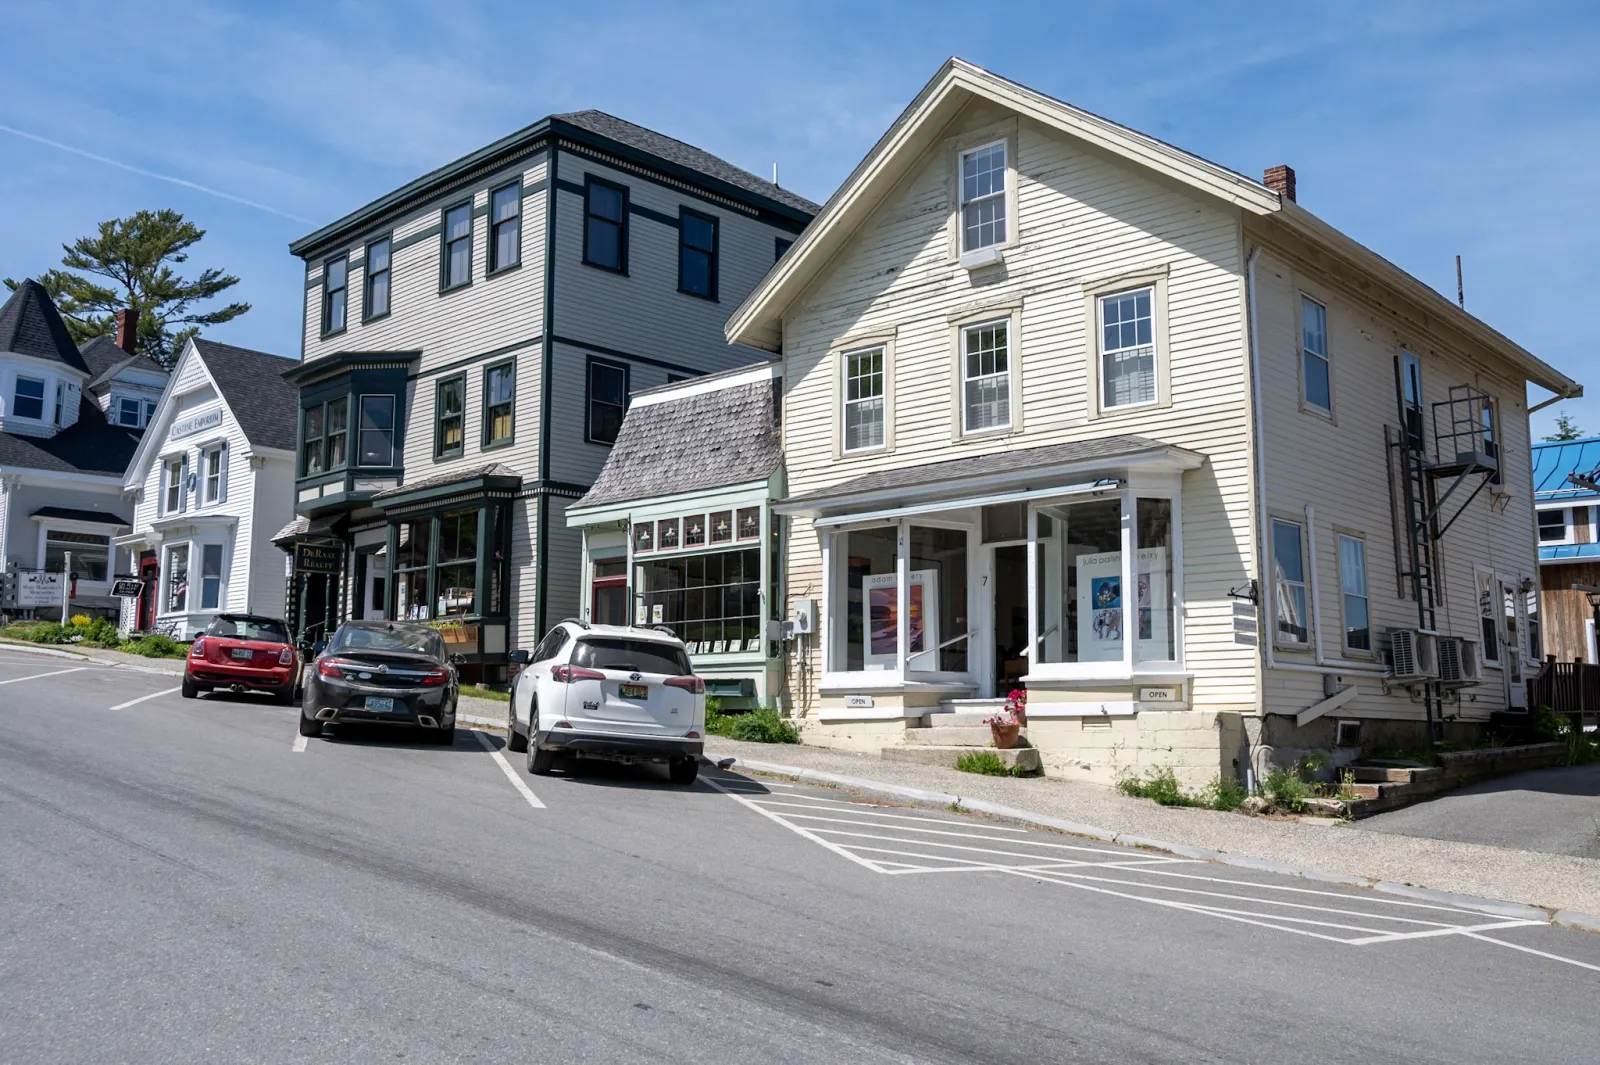
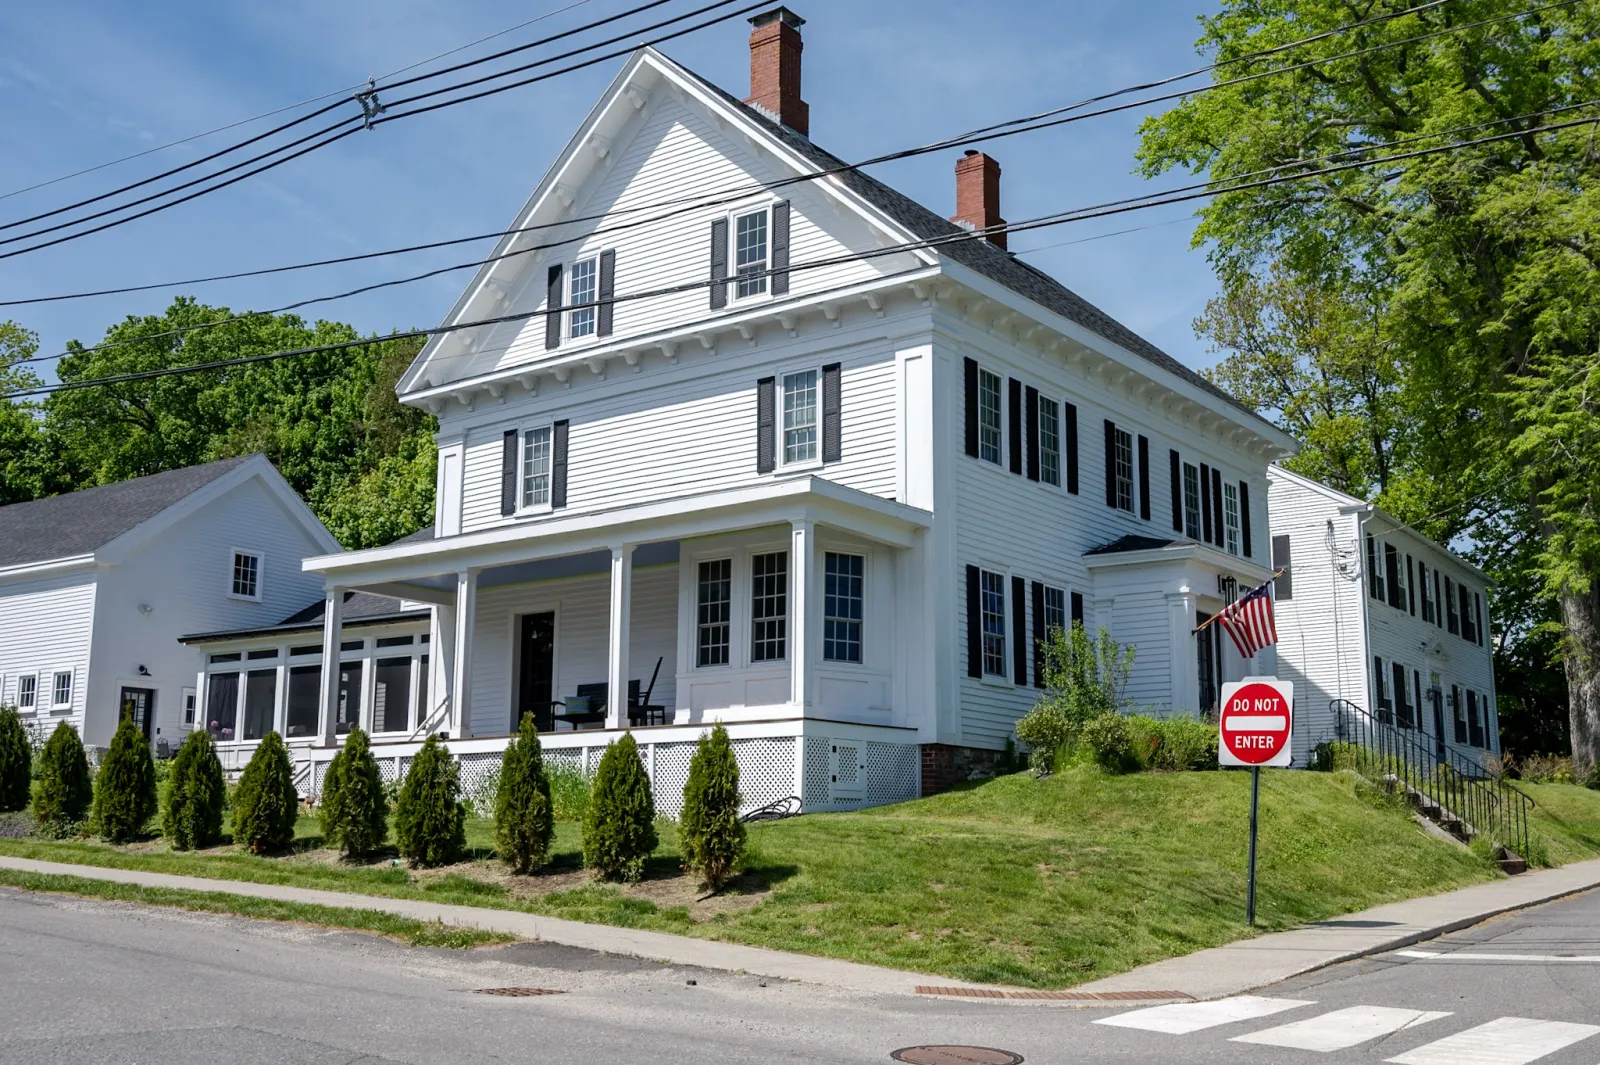
HOOP is a collaboration between Blue Hill, Brooklin, Brooksville, Castine, Deer Isle, Orland, Penobscot, Sedgwick, Stonington and Surry. The project is funded by a Municipal Housing Grant through the Maine Department of Economic and Community Development (DECD). HOOP is led by community members from each town, alongside the Hancock County Regional Planning Commission and consultants CommunityScale in partnership with Neighbor Architects (architecture & design), and Levine Planning Strategies (housing policy expert).
Project timeline
Key moments in the HOOP project, from the spring kickoff through the fall public meeting and the final Housing Development Toolkit.
- March 2026Project kickoffMilestoneThe 10-town HOOP collaboration launched and the team began the peninsula-wide housing needs assessment.
- June 2026Community committee meetingCommittee meetingHOOP committee members from each town reviewed early housing-needs findings and discussed strategies for the peninsula.
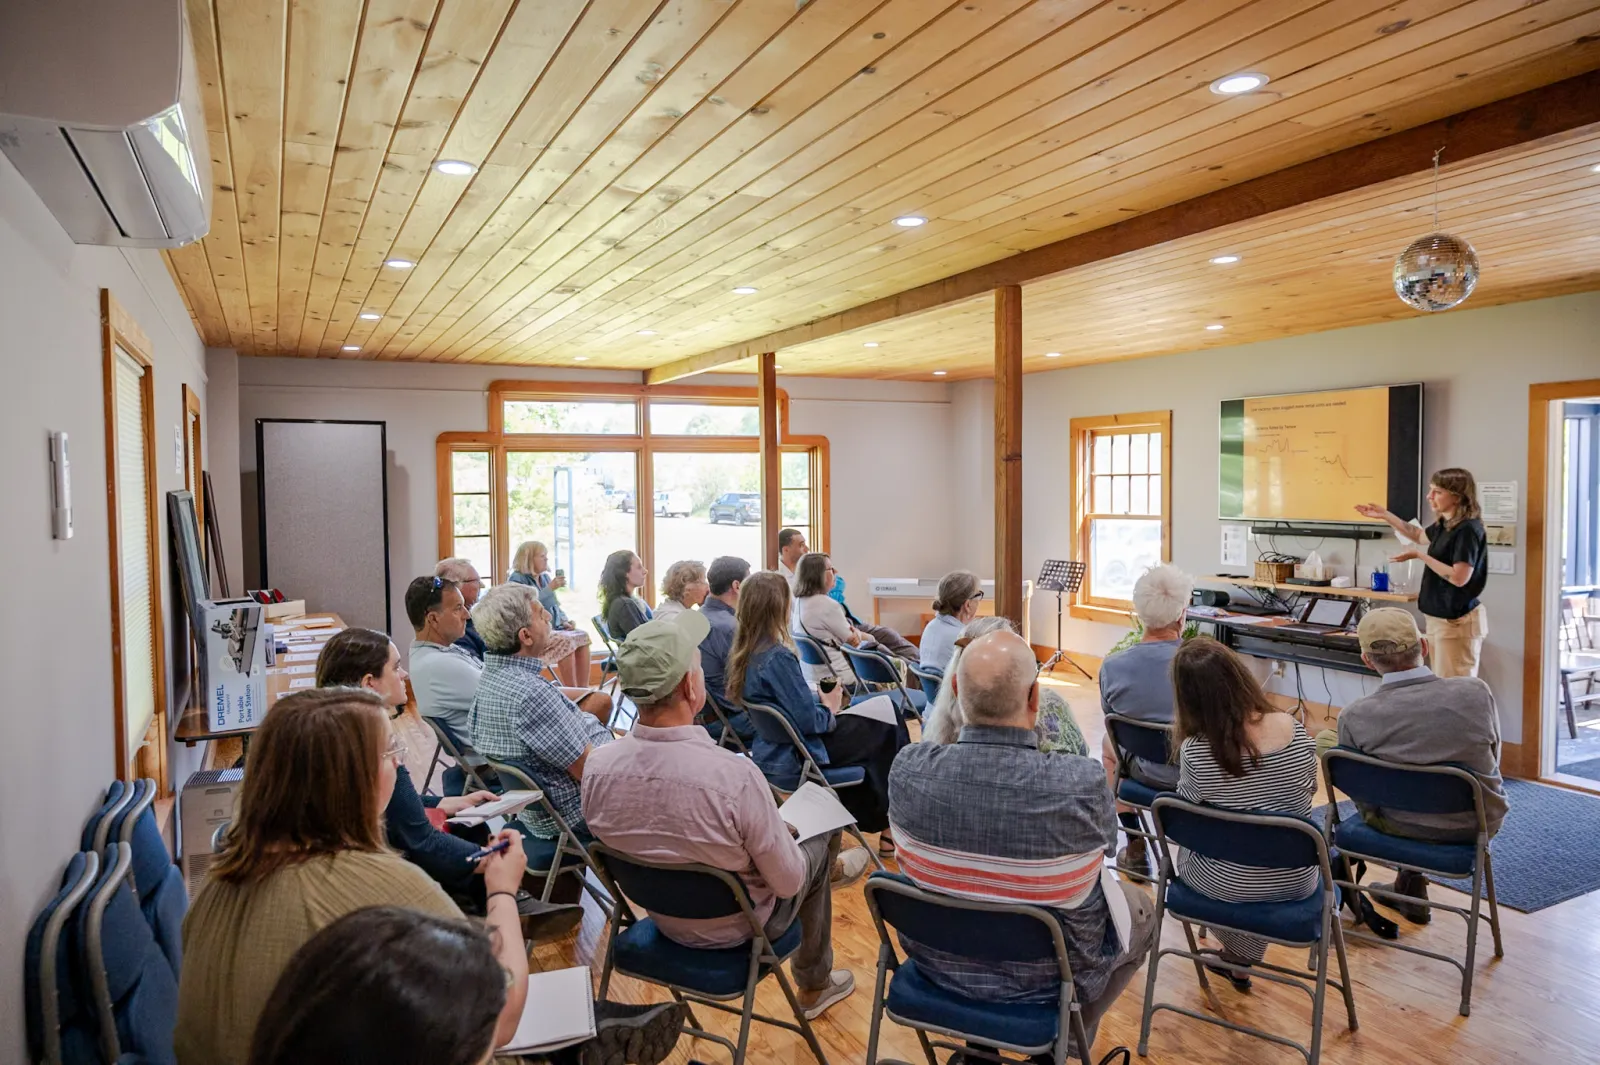
- September 2, 2026, 6:30 PMPublic meetingPublic meetingA public meeting to present housing case studies, announce the new peninsula housing group, and share strategies. Join us on Wednesday, September 2 at 6:30 PM at Blue Hill Town Hall.
- December 2026Housing Development ToolkitDeliverableNEXT UPThe team delivers the Housing Development Toolkit: context-specific case studies for missing middle housing with construction, infrastructure, financing, and regulatory strategies.
How affordable is this community?
- ACS 5-year estimates · B19013, B25082, B25090 · 2010–2024
- Zillow ZHVI
- FRED 30-year fixed mortgage rate
- Insurance premium rates (CommunityScale)
This chart tracks whether housing prices are keeping pace with local incomes. The gap between what homes cost and what households can afford reveals affordability trends over time.
| Geography | Home Price | ||
|---|---|---|---|
| Typical | Affordable to median | Gap / Surplus | |
| Blue Hill Peninsula | $435,054 | $333,166 | -$101,888 |
| Blue Hill, ME | $507,324 | $390,792 | -$116,532 |
| Brooklin, ME | $461,036 | $334,259 | -$126,778 |
| Brooksville, ME | $528,468 | $199,760 | -$328,708 |
| Castine, ME | $375,185 | $564,473 | +$189,288 |
| Deer Isle, ME | $421,580 | $297,932 | -$123,648 |
| Orland, ME | $302,899 | $367,602 | +$64,703 |
| Penobscot, ME | $355,092 | $276,746 | -$78,346 |
| Sedgwick, ME | $441,941 | $330,819 | -$111,122 |
| Stonington, ME | $508,686 | $235,760 | -$272,926 |
| Surry, ME | $448,331 | $343,360 | -$104,971 |
How are households changing by income?
- ACS 5-year estimates · B25007, B01001, B19001, B19113 · 2010–2024
- HUD Income Limits · FY 2025
- BLS CPI-U · 2010–2024
- Census PUMS 5-year · 2019–2023
Understanding how households at different income levels are growing or declining helps identify which groups face the greatest housing pressure and where new housing is most needed.
| AMI Group | Income Range | Households |
|---|---|---|
| <30% AMI | <$30K | 1,528 |
| 30-50% AMI | $30K - $51K | 1,028 |
| 50-80% AMI | $51K - $81K | 1,526 |
| 80-100% AMI | $81K - $101K | 835 |
| 100-120% AMI | $101K - $121K | 397 |
| >120% AMI | >$121K | 1,767 |
How is the population changing?
- Census Population Estimates Program (PEP) · 2010–2025
- ACS 5-year estimates · B01001 · 2010–2024
- CommunityScale population projection model
Population growth patterns reveal how communities are evolving. This chart shows historical population changes by age group and projects future trends based on demographic patterns.
The share of households with children indicates family housing demand, while the share with people over 65 reflects the growing need for senior-friendly and accessible housing options.
The share of people aged 25-34 indicates the pipeline of workers entering the labor force, while the share aged 65+ shows the pace of retirement. Comparing these trends reveals whether communities face a tightening or expanding labor supply.
Historical population comes from the U.S. Census Bureau's Population Estimates Program (PEP): counties directly from PEP's annual estimates by age, and municipalities from PEP sub-county totals with age detail from the American Community Survey (ACS). Projections use CommunityScale's PEP-anchored cohort-migration forecast model.
The model follows each five-year age cohort through the community's 2010–2024 population history and projects those cohort trends forward, launching from the most recent PEP estimate (2025). Group-quarters residents — college dorms, prisons, military barracks, nursing facilities — do not follow household demographics, so they are separated out, projected on their own trend, and added back. In small communities, where year-to-year cohort data is noisy, the model blends each cohort's trend toward the community's recent overall trend to keep projections stable.
How are household types changing?
- ACS 5-year estimates · B09021, B11015, B19131 · 2010–2024
This chart shows how household composition has changed over time, comparing the distribution of household types between 2015 and 2023. Changes in household types can indicate shifting demographics and evolving housing needs in a community.
Households may have different structure type preferences depending on characteristics such as household size, income, employment, presence of children, age of individuals, and lifestyle choices. Understanding the housing stock in corresponding terms helps assess how well existing units align with existing households' ideals.
Cost burden measures the share of household income spent on housing. Households paying more than 30% are considered cost burdened, while those paying more than 50% are severely cost burdened. Lower-income households typically face the highest rates of cost burden.
Household type data comes from the American Community Survey (ACS) 5-year estimates. Household types include family households (married couples, single parents) and non-family households (people living alone, unrelated roommates).
What does the housing stock look like?
The mix of housing types and ownership patterns shapes a community's character. This chart breaks down housing units by structure type and whether they're owner-occupied or rented.
This chart shows rental and homeowner vacancy rates over time. A healthy rental vacancy rate is around 7.5%, and a healthy homeowner vacancy rate is around 1.5%. Rates well below these thresholds suggest a tight housing market with limited options for people looking to move.
How much new housing is being permitted?
Annual building permits reflect the pipeline of new housing construction. Single family permits show detached home building activity, while multifamily permits (units in buildings with 2+ units) indicate apartment and townhome development. Together they reveal how a community's housing supply is growing and what types of housing are being added.
Building permit data comes from the US Census Building Permit Survey, 2010-2024. Permits are reported by county and by permit-issuing place.
How is the job market changing?
Total job counts over time show how employment opportunities are growing or shrinking in a community. Comparing across geographies reveals which areas are attracting the most new employment.
Jobs grouped into four broad sector categories show the economic composition of a community.
The ratio of jobs to housing units indicates whether a community has a balance between employment opportunities and available housing.
Job counts are derived from the LEHD LODES Workplace Area Characteristics (WAC) dataset published by the US Census Bureau.
How are jobs and households changing?
Cumulative change in jobs and households since 2010 shows whether the peninsula's housing demand is growing faster than employment.
Jobs from LEHD LODES WAC and households from ACS estimates.
Seasonal Housing Trends
From 2019-2024, the Blue Hill Peninsula has seen an overall increase in the number of mortgages for primary residences (as opposed to second homes or investment properites), and a decrease in units that are seasonally vacant. At the same time, the percentage of remote workers has increased sharply.
| Primary-Residence Mortgages: Change (%) | Seasonal Vacancy: Change (%) | Work-From-Home Workers: Change (%) | |
|---|---|---|---|
| Orland | -0.2% | -20% | 323% |
| Surry, Blue Hill | -0.2% | -15% | 279% |
| Penobscot, Castine | 36.3% | -14% | 33% |
| Brooksville, Sedgwick, Brooklin | 35.7% | -22% | 0% |
| Deer Isle, Stonington | 44.4% | -27% | 76% |
Mortgage data from HMDA (Home Mortgage Disclosure Act) published by the Consumer Financial Protection Bureau. Seasonal vacancy and remote work data from the Americ
Short-Term Rentals
Just under 10% of homes on the Blue Hill Peninsula are used for short-term rentals (STRs), with an average of 200 active listings each month. These rates are lower than neighboring communities, with the highest rates on Mount Desert Island.
| Short-term rental submarket | % homes used as STRs |
|---|---|
| Surry, Blue Hill | 8.3% |
| Penobscot, Castine | 8.4% |
| Brooksville, Sedgwick, Brooklin | 8.3% |
| Deer Isle, Stonington | 9.1% |
| Ellsworth | 10.1% |
| Bar Harbor | 21.7% |
| Mount Desert | 14.5% |
| Southwest Harbor | 21.8% |
| Tremont/Seal Cove | 17.5% |
| Winter Harbor | 16.0% |
AirDNA.com, 2021-2024, from the 2025 Hancock County Housing Needs Assessment. (Orland is not included because it is part of a larger, non-Blue Hill Peninsula short-term rental submarket.)
How much new housing supply is needed?
To keep up with growth and fill current housing shortages, Blue Hill Peninsula needs 712 new units over the next 5 years.
| 481 |
Units needed to keep up with expected growth
Projected total household growth from 2026 to 2031.
|
| 6.7% |
Projected household growth rate
Expected increase in total households from 7,206 in 2026 to 7,687 in 2031.
|
| 231 |
Units to address shortages in existing housing stock
Production needs to address vacancy rates and other factors.
|
| 77 |
Replacement housing
Effective annual loss rate is 1.4 per 1,000 units.
|
| 76 |
Rental vacancy adjustment
Rental vacancy is 1.4%. This is below the minimum stable target of 7.4%.
|
| 78 |
Substandard housing adjustment
Substandard housing rate is 2.11%. This is above National avg. of 0.98%.
|
| 712 |
Total 5-year housing production need (2026-2031)
|
| 142 |
Annual production pace
Average units needed per year to meet 5-year need
|
| 6.3% |
Total housing unit growth
Percent increase in housing stock over 5 years
|
| 1.3% |
Annual housing unit growth
Average percent increase in housing stock per year
|
The five housing needs, in priority order
Ranked by depth of need (who the market serves least on its own, not by headcount), with the price each type must hit.
- 1Affordable & workforce rental$760-1,520 / mo · studio-2 BR · 30-60% AMIThe biggest net rental need by far: nearly all studio-2 BR at $760-1,520/mo. The single largest gap is 2-bedroom homes near $1,000-1,500.
- 2Deeply affordable rentalUnder $760 / mo · studio-1 BR · below 30% AMIThe deepest shortage. At this rent almost nothing ever comes up for rent; it only exists if it's subsidized.
- 3Entry / workforce ownership$240k-395k · 2-3 BR · deed-restrictedThe hardest home to buy here. Homes that free up get bought as second homes, so they rarely reach local buyers.
- 4Senior / downsizer homes$1,500-2,000 / mo or $240k-315k · 1-2 BR, single-levelThe unlock: small homes exist, but older owners won't leave a big house without a single-level one to move into; each one built frees up a family home.
- 5Family rental$2,025-2,530 / mo · 3+ BR · 80-100% AMIBigger families who rent need three bedrooms, easy to overlook when attention is on small apartments.